Log Entry 1: The Pantry Departure
At 0600 hours, the kitchen light feels harsher than it should. A brightly colored breakfast pastry sits on the counter while I turn the package over and read the ingredient list like a navigator checking coordinates before departure.
The front of the package tells me almost nothing. Blue icing may contain several colors, one color, or no synthetic dye at all. A beige cereal or snack can still contain dye used to standardize its appearance. Package color is not evidence of exposure; the ingredient list is.
Finding the dyes hiding in plain sight
Watch the first six hours
Red 40 may appear as “Red 40,” “FD& C Red No. 40,” or “Allura Red AC.” Yellow 5 may be listed by its common name or as an FD& C color. These petroleum-derived synthetic colorings often sit near flavors, preservatives, and sweeteners, which makes them easy to skim past.
Before changing the diet, record the product name, serving size, amount eaten, dye names, and consumption time. Ingredient lists generally identify which dye is present, but they do not disclose its milligram quantity. That missing quantity limits any attempt to calculate a precise dose from a grocery label.
Field Note: Photograph the full ingredient panel rather than copying only the color name. If behavior changes later, the photograph preserves other possible contributors such as sodium benzoate or caffeine.
What the regulatory numbers can and cannot tell us
The acceptable daily intake is 7 milligrams per kilogram of body weight per day for Red 40 and approximately 7.5 milligrams per kilogram per day for Yellow 5. These are toxicology limits used for regulatory context. They do not identify the dose at which an individual child might show a behavioral response.
That distinction establishes the baseline for this investigation. The useful question is not simply, “Is the intake below a regulatory limit?” It is whether a repeatable change in attention, activity, skin symptoms, digestion, or sleep follows a documented exposure under comparable conditions.
Log Entry 3: Navigating the Biochemical Storm
Does a swallowed dye travel straight to the brain?
No. That shortcut makes a compelling diagram, but it overstates what has been demonstrated.
Synthetic azo dyes first meet digestive enzymes and intestinal microbes. Those microbes can reduce the dyes into smaller aromatic metabolites. Some material may be absorbed, yet the route from intestinal metabolism to a specific behavioral effect is not a straight, fully mapped channel.
Claims that Red 40 or Yellow 5 simply crosses a child’s blood-brain barrier and then disrupts neurons should therefore be treated cautiously. Proposed explanations include barrier interactions, altered mineral handling, histamine-related responses, and downstream effects on neural signaling. These mechanisms are not equally established in children, and a behavior log cannot determine which one occurred.

A focused exposure record covers the meal and the following six hours. Note skin flushing, hives, gastrointestinal symptoms, activity level, and sleep onset. This window helps prevent a common charting error: attaching every difficult behavior later that day to a dye eaten in the morning.
Histamine-related symptoms deserve their own line in the record. Hives or flushing are not interchangeable with inattention, and combining them under a vague entry such as “reaction” makes the record less useful.
For a 20-kilogram child, the regulatory intake equivalents are 140 milligrams per day for Red 40 and 150 milligrams per day for Yellow 5. These calculations provide dose context only. They are not consumption targets, and they do not prove that a lower exposure cannot affect a sensitive child.
Important: A red drink is a mixed exposure unless every ingredient is controlled. A recorded response could relate to Red 40, another color, sodium benzoate, caffeine, a large sugar load, or the setting in which the drink was consumed.
Log Entry 7: The Neurological Squall
Parents usually ask about brain damage. The more defensible discussion begins elsewhere: controlled human trials have mainly measured activity, attention, and ratings from parents or teachers. They have not directly documented visible neuronal injury from ordinary dietary dye exposure.
What the behavioral evidence measures
A prominent six-week randomized, double-blind trial included 153 three-year-olds and 144 children aged eight to nine. Participants received daily drinks containing mixtures of artificial colors plus sodium benzoate. The younger children’s drinks supplied either 20 or 30 milligrams of artificial colors per day, an exposure comparable to several brightly colored foods rather than a trace experimental dose.
The combined formulation matters. Because colors and sodium benzoate appeared together, the trial could not isolate Red 40, Yellow 5, or any other single ingredient. The clinical data on hyperactivity and neurodevelopmental disruptions are useful for examining mixture effects, not for assigning blame to one dye in one child.
Dopamine, norepinephrine, and the limits of inference
Dopamine and norepinephrine pathways help regulate attention, motivation, arousal, and impulse control. They are reasonable pathways to investigate when activity changes after exposure. Still, a higher parent rating or poorer attention-task result does not reveal which neurotransmitter changed, whether either pathway was directly affected, or whether the effect arose through another physiological route.
Individual sensitivity may reflect genetic predisposition, metabolism, allergic-type responses, or other features that are not visible on a food label. Current clinical evidence does not provide a reliable personal threshold. Observed changes in activity or attention do not demonstrate structural brain damage, and group findings cannot predict one child’s response.
This is the topic-specific boundary worth keeping in view: behavioral outcomes are measurable, but the precise neural route remains unsettled.
Log Entry 14: Charting the Behavioral Impact
A single frantic afternoon proves very little. The useful comparison is repeated behavior under similar conditions: the same weekday, the same homework or play period, and roughly comparable sleep and meals.
Build a record before removing the dyes
During protocol evaluations, start with a 14-day baseline. Continue the child’s usual diet while recording labeled synthetic colors and a small set of predefined outcomes. Follow that baseline with 14 to 21 days without listed synthetic colors.
Compare matched weekdays and the same two-hour observation window whenever possible. A quiet Sunday morning should not be compared with a rushed school-night homework session.
- Record task persistence in minutes. Choose one familiar activity and note how long the child remains engaged.
- Count adult redirections. Use a defined 30-minute activity rather than estimating across the entire day.
- Write down sleep onset time. Record the clock time instead of using labels such as “slept badly.”
- List every dyed food consumed. Include drinks, frostings, candy, packaged snacks, and medicines when their labels list synthetic colors.
- Note the surrounding conditions. Sleep loss, caffeine, an unstable meal pattern, and an unusually stimulating setting can alter the same behaviors being tracked.
Entries such as “hyper,” “wild,” or “much better” feel clear in the moment but are hard to compare two weeks later. Minutes, redirection counts, and clock times create a more interpretable chart.
Compare patterns, not memorable incidents
Suppose task persistence rises during the dye-free phase but bedtime also moves earlier by an hour. The improvement cannot automatically be assigned to dye removal. Sleep may be contributing. The next step is to preserve the earlier bedtime and continue observing, not to erase the sleep variable from the story.
The reverse comparison matters too. A child may remain inattentive after complete dye elimination because sleep loss, ADHD, anxiety, a learning difficulty, medication timing, or an unstable meal pattern is driving the behavior. Dye removal can answer a narrow exposure question; it cannot diagnose the source of every attention problem.
Bottom Line: Treat the elimination phase as a controlled comparison. Keep routines steady, define behaviors before starting, and resist rewriting the outcome around one especially calm or difficult day.
Log Entry 21: Reaching Clear Waters
Recognizing a return to baseline
Removing synthetic dyes reduces exposure quickly, but there is no validated neurological “reset” timetable. A return-to-baseline claim becomes credible only when the recorded measures improve across multiple comparable days.
Look for at least seven consecutive dye-free days with similar sleep and routine. Retain the complete 14-to-21-day elimination record because the uneven days are informative. A sustained pattern carries more weight than a dramatic change on day two.
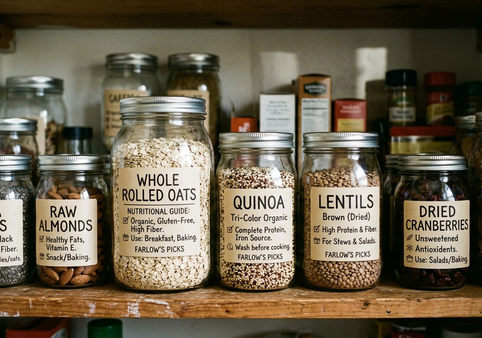
A dye-free menu does not need to become elaborate. Steel-cut oats, fresh fruit, eggs, beans, vegetables, plain dairy foods, and minimally processed staples make label review easier. Organic whole foods may fit the family’s approach, but the practical target is the absence of listed synthetic colors, not an assumption that every organic package is automatically relevant to the experiment.
If reintroduction is considered
Introduce one labeled product at a time and observe the same predefined behaviors for the following six hours and again at bedtime. A multicolored drink with preservatives and caffeine is a poor challenge product because any response remains impossible to assign to one component.
Hives, wheezing, facial swelling, or breathing difficulty require medical evaluation rather than a home rechallenge. Those symptoms belong outside a behavioral experiment.
On a quiet Tuesday morning, a bowl of steel-cut oats cools beside a handful of fresh blueberries. Across the table, a child turns a wooden puzzle piece twice, finds the matching groove, and settles into the next section without leaving the chair. The kitchen clock ticks past breakfast while the puzzle slowly takes shape.